Drug prices
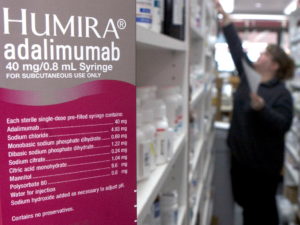
Finally! Humira’s biosimilars also hit the us market!
Humira was first marketed in 2002 and was protected in the US market until 2023, thanks to AbbVie’s use of two strategies :


Humira was first marketed in 2002 and was protected in the US market until 2023, thanks to AbbVie’s use of two strategies :

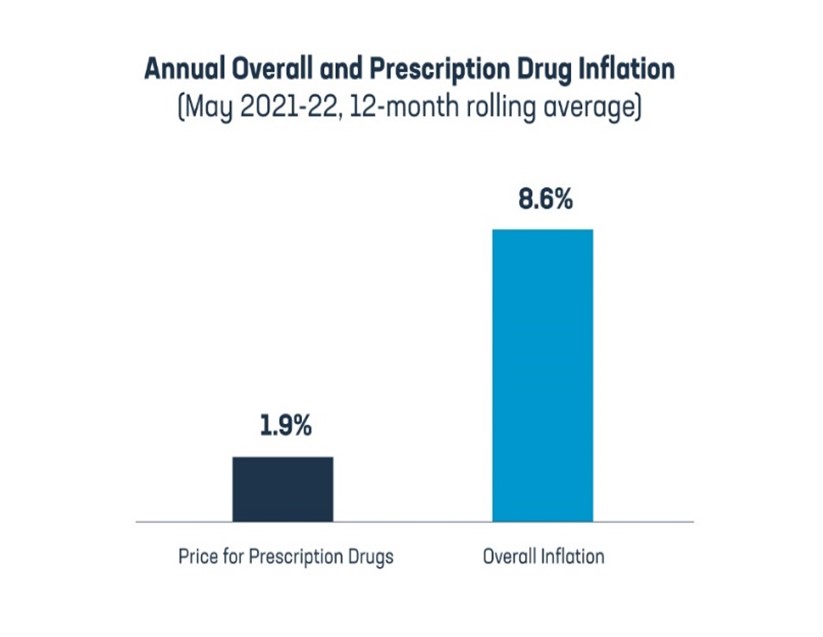
After wrapping up the 2023 enrollment, employers are now planning their next moves to mitigate the continuously growing healthcare costs impacting their plans. This is particularly true for pharmacy costs.

100 million Americans, insured or not, are saddled with medical debt, a recent survey by Kaiser Family Foundation established.
